Linux kernel perf architecture
Component overview
Linux perf subsystem is very useful in performance profiling. Following shows the perf subsystem componenet, from this post.
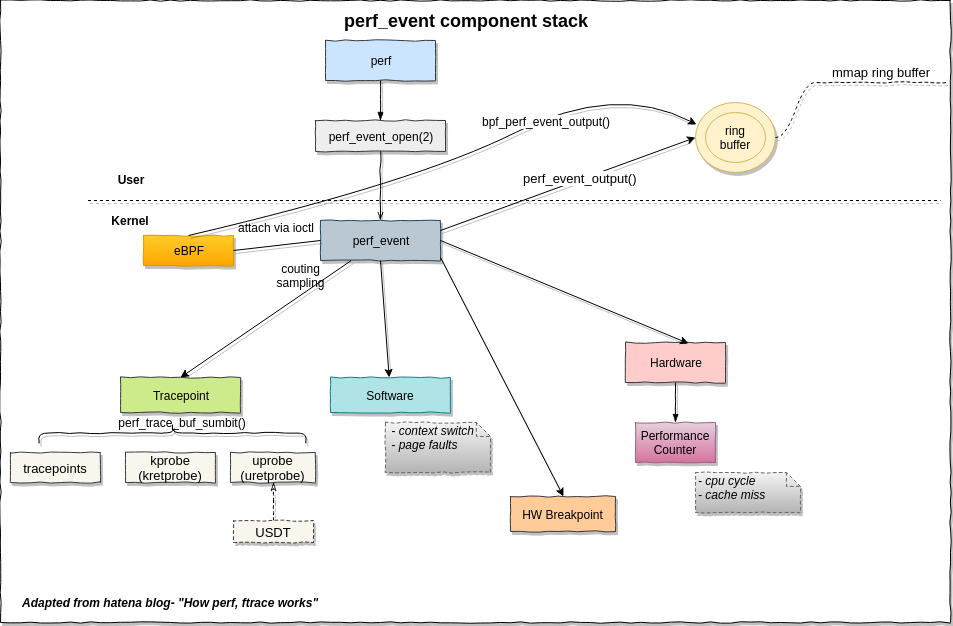
‘perf’ is the user program that can be used to do performance profiling.
There only exposed to userspace syscall perf_event_open returns an perf event fd. This syscall has no glibc wrapper. More info can be read in man page. This function is one of the most complicated function.
‘perf_event’ is the core struct in kernel. There are several types of perf event, such as tracepoint, software, hardware.
We can also attach eBPF program to trae event through perf event fd.
Abstract layer
Following shows the abstract layer of perf.
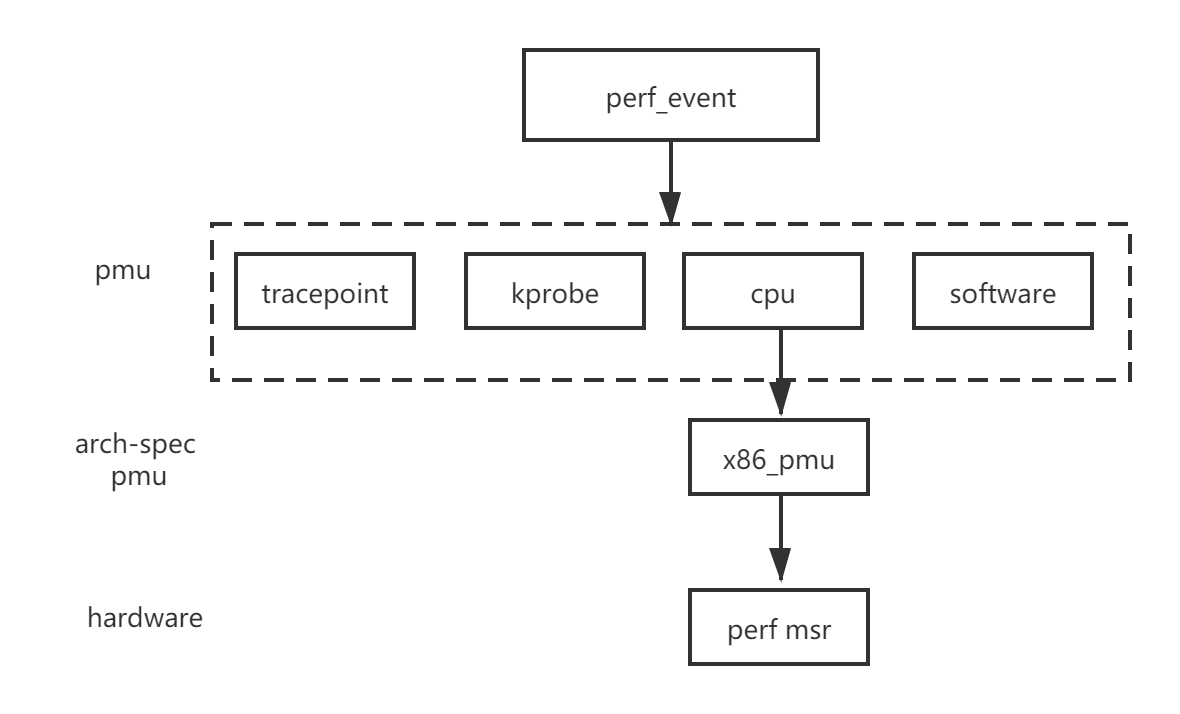
Every type perf event has a corresponding PMU(performance monitor unit). For example the tracepoint pmu has following pmu.
    static struct pmu perf_tracepoint = {
        .task_ctx_nr	= perf_sw_context,

        .event_init	= perf_tp_event_init,
        .add		= perf_trace_add,
        .del		= perf_trace_del,
        .start		= perf_swevent_start,
        .stop		= perf_swevent_stop,
        .read		= perf_swevent_read,
    };
The hardware related PMU has the arch-spec related abstract structure like the ‘struct x86_pmu’. The hardware related structure will read/write the performance monitor MSR.
Every PMU is registerd by calling ‘perf_pmu_register’.
Perf event context
The perf can monitor cpu-related and task-related events. And both of them can have several monitored events. So we need a context to connects the events. This is ‘perf_event_context’.
There are two kinds of context, software and hardware, defined as follows:
    enum perf_event_task_context {
        perf_invalid_context = -1,
        perf_hw_context = 0,
        perf_sw_context,
        perf_nr_task_contexts,
    };
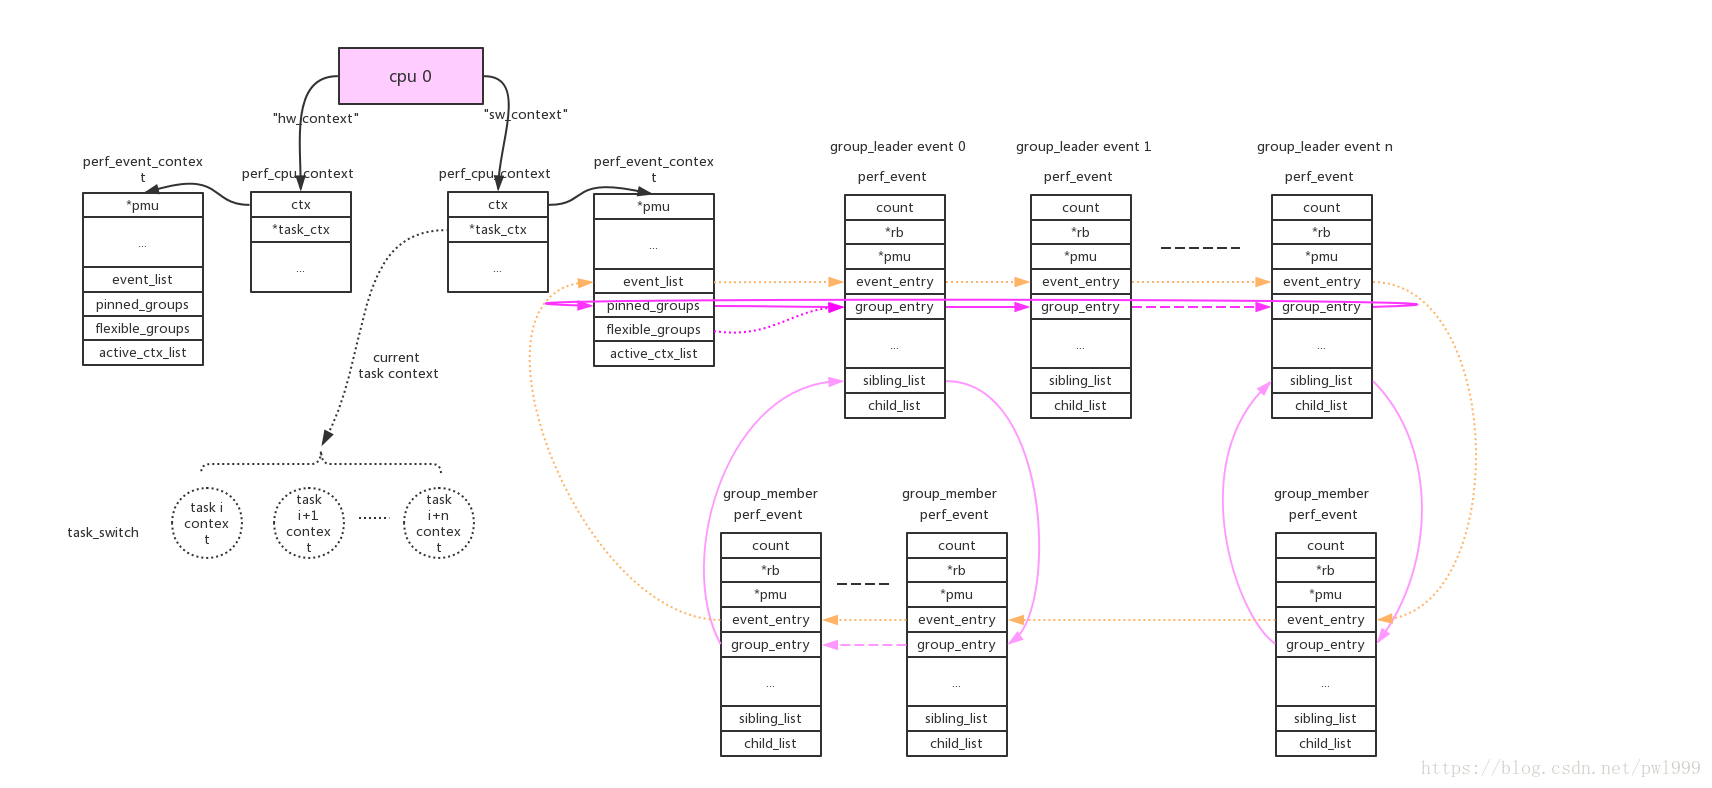
For CPU level, the context is defined as ‘perf_cpu_context’ and is defined as percpu variable in ‘struct pmu’.
    struct pmu {
        ...
        struct perf_cpu_context __percpu *pmu_cpu_context;
    };
If the PMU is the same type, they will share one ‘struct perf_cpu_context’.
    int perf_pmu_register(struct pmu *pmu, const char *name, int type)
    {
        int cpu, ret, max = PERF_TYPE_MAX;

        mutex_lock(&pmus_lock);
        ...
        pmu->pmu_cpu_context = find_pmu_context(pmu->task_ctx_nr);
        if (pmu->pmu_cpu_context)
            goto got_cpu_context;

        ret = -ENOMEM;
        pmu->pmu_cpu_context = alloc_percpu(struct perf_cpu_context);
        if (!pmu->pmu_cpu_context)
            goto free_dev;

        for_each_possible_cpu(cpu) {
            struct perf_cpu_context *cpuctx;

            cpuctx = per_cpu_ptr(pmu->pmu_cpu_context, cpu);
            __perf_event_init_context(&cpuctx->ctx);
            lockdep_set_class(&cpuctx->ctx.mutex, &cpuctx_mutex);
            lockdep_set_class(&cpuctx->ctx.lock, &cpuctx_lock);
            cpuctx->ctx.pmu = pmu;
            cpuctx->online = cpumask_test_cpu(cpu, perf_online_mask);

            __perf_mux_hrtimer_init(cpuctx, cpu);

            cpuctx->heap_size = ARRAY_SIZE(cpuctx->heap_default);
            cpuctx->heap = cpuctx->heap_default;
        }

    ...
    }
Following pic shows the related structure, from this post.
For task level, the ‘task_struct’ has a pointer array defined as this:
    struct task_struct {
        struct perf_event_context	*perf_event_ctxp[perf_nr_task_contexts];
    };
Following pic shows the related structure, also from this post.
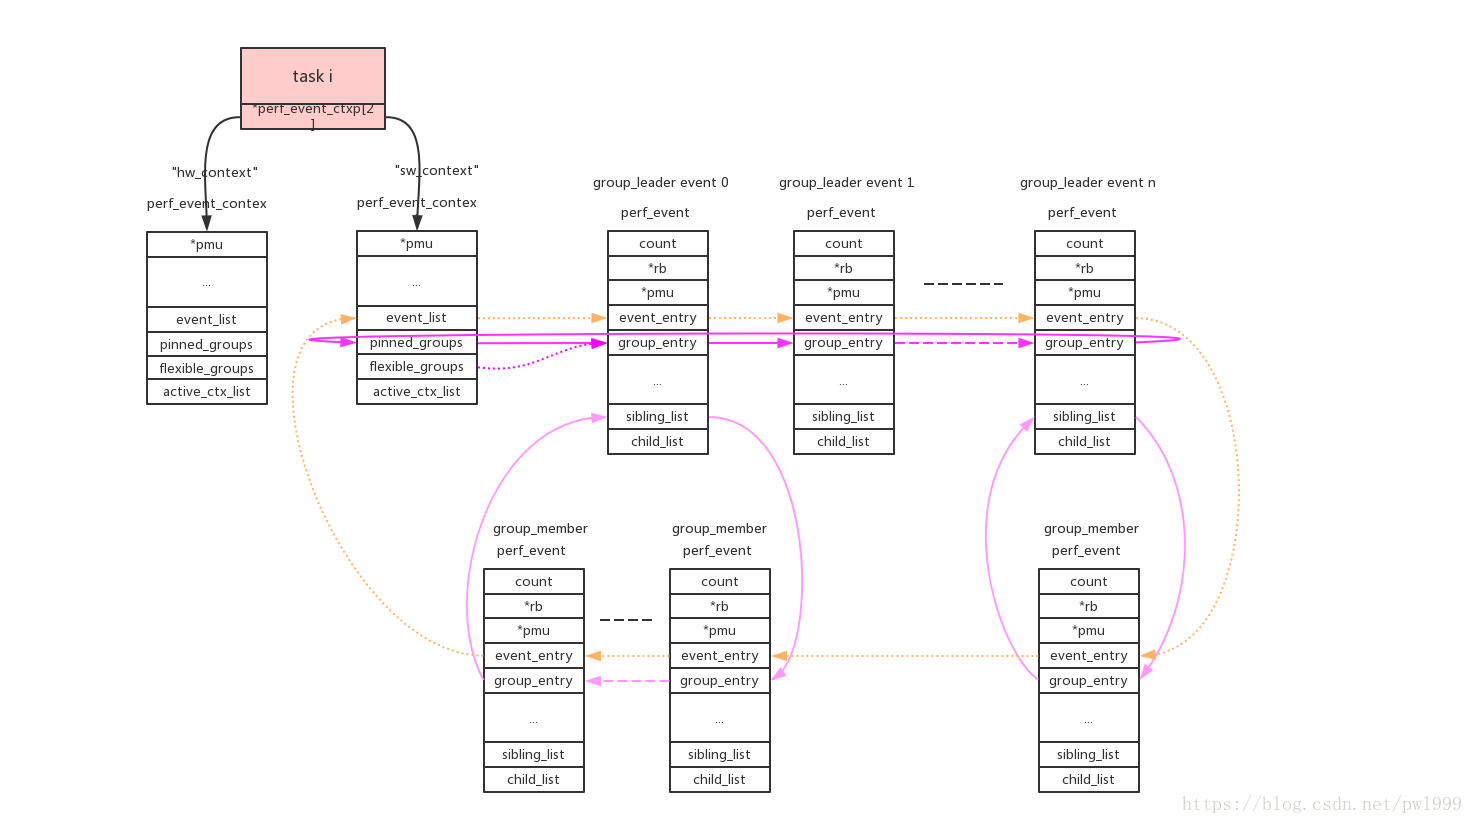
The CPU level perf event will be triggered while the cpu is online. But for task level perf event, it will be only trigged by running the task. The ‘perf_cpu_context’s task_ctx contains the current running task’s perf context.
Perf event context schedule
One of the perf’s work is to schedule in and out the perf_event_context of the task.
Following pic shows the task schedule in and out function related with perf.
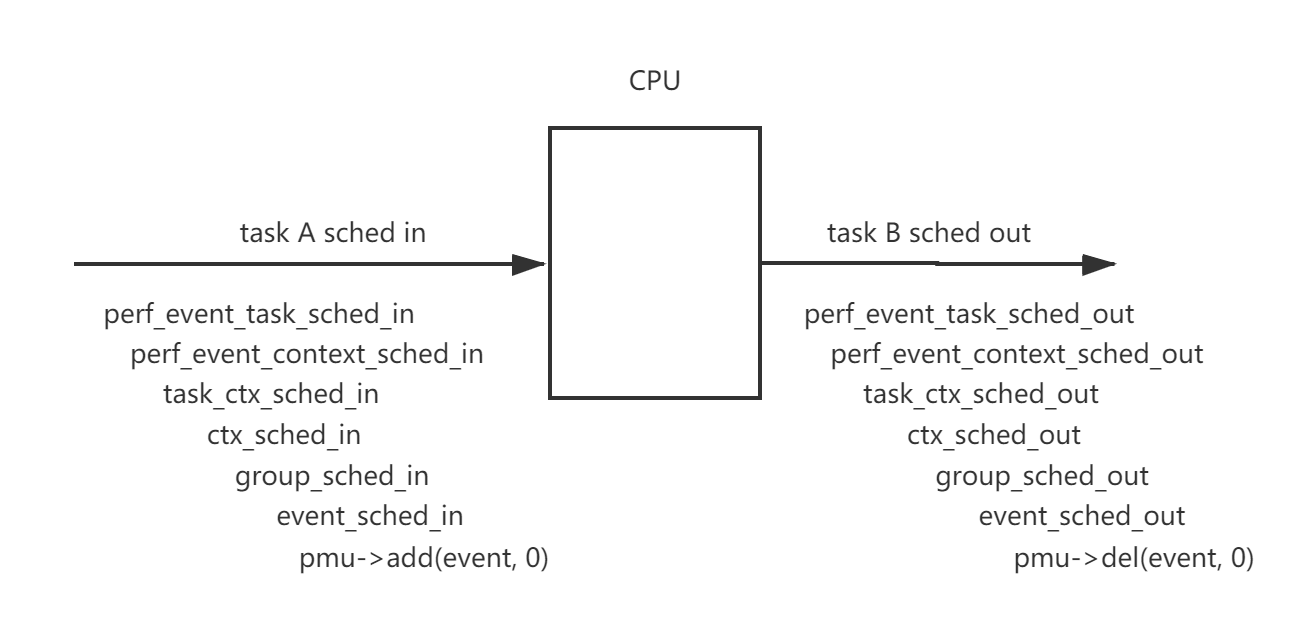
Finally the PMU’s add and del callback will be called. Let’s use tracepoint as an example. The add callback is ‘perf_trace_add’ and the del callback is ‘perf_trace_add’.
    int perf_trace_add(struct perf_event *p_event, int flags)
    {
        struct trace_event_call *tp_event = p_event->tp_event;

        if (!(flags & PERF_EF_START))
            p_event->hw.state = PERF_HES_STOPPED;

        /*
        * If TRACE_REG_PERF_ADD returns false; no custom action was performed
        * and we need to take the default action of enqueueing our event on
        * the right per-cpu hlist.
        */
        if (!tp_event->class->reg(tp_event, TRACE_REG_PERF_ADD, p_event)) {
            struct hlist_head __percpu *pcpu_list;
            struct hlist_head *list;

            pcpu_list = tp_event->perf_events;
            if (WARN_ON_ONCE(!pcpu_list))
                return -EINVAL;

            list = this_cpu_ptr(pcpu_list);
            hlist_add_head_rcu(&p_event->hlist_entry, list);
        }

        return 0;
    }

    void perf_trace_del(struct perf_event *p_event, int flags)
    {
        struct trace_event_call *tp_event = p_event->tp_event;

        /*
        * If TRACE_REG_PERF_DEL returns false; no custom action was performed
        * and we need to take the default action of dequeueing our event from
        * the right per-cpu hlist.
        */
        if (!tp_event->class->reg(tp_event, TRACE_REG_PERF_DEL, p_event))
            hlist_del_rcu(&p_event->hlist_entry);
    }
The ‘perf_event’ will be added or removed to the ‘tp_event->perf_events’ lists.
perf_event_open flow
    perf_event_open
        ->perf_copy_attr
        ->get_unused_fd_flags(fd)
        ->perf_event_alloc
            ->perf_init_event
                ->perf_try_init_event
                    ->pmu->event_init()
        ->find_get_context
        ->perf_install_in_context
            ->__perf_install_in_context
                ->add_event_to_ctx
                    ->list_add_event
                    ->perf_group_attach
            ->add_event_to_ctx
        ->fd_install
perf_event_open will call ‘pmu->event_init’ to initialize the event. And add the perf_event to a perf_event_context.
tracepoint event in perf
Recall the definition of tracepoint PMU.
    static struct pmu perf_tracepoint = {
        .task_ctx_nr	= perf_sw_context,

        .event_init	= perf_tp_event_init,
        .add		= perf_trace_add,
        .del		= perf_trace_del,
        .start		= perf_swevent_start,
        .stop		= perf_swevent_stop,
        .read		= perf_swevent_read,
    };
Let’s try to figure how the perf subsystem monitor tracepoint event.
perf event initialization
‘perf_tp_event_init’ is called.
perf_tp_event_init
    ->perf_trace_init
        ->perf_trace_event_init
            ->perf_trace_event_reg
                ->tp_event->class->reg(TRACE_REG_PERF_REGISTER)
‘perf_trace_init’ will find the specified tracepoint.
‘perf_trace_event_reg’ will allocate and initliaze ‘tp_event_perf_events’ list. and call the ‘tp_event->class->reg’ with TRACE_REG_PERF_REGISTER.
static int perf_trace_event_reg(struct trace_event_call *tp_event,
                struct perf_event *p_event)
{
    struct hlist_head __percpu *list;
    int ret = -ENOMEM;
    int cpu;

    p_event->tp_event = tp_event;
    if (tp_event->perf_refcount++ > 0)
        return 0;

    list = alloc_percpu(struct hlist_head);
    if (!list)
        goto fail;

    for_each_possible_cpu(cpu)
        INIT_HLIST_HEAD(per_cpu_ptr(list, cpu));

    tp_event->perf_events = list;

    ...
    ret = tp_event->class->reg(tp_event, TRACE_REG_PERF_REGISTER, NULL);
    if (ret)
        goto fail;

    total_ref_count++;
    return 0;
    ...
}
The ‘tp_event->class->reg’ callback is ‘trace_event_reg’.
    int trace_event_reg(struct trace_event_call *call,
                enum trace_reg type, void *data)
    {
        struct trace_event_file *file = data;

        WARN_ON(!(call->flags & TRACE_EVENT_FL_TRACEPOINT));
        switch (type) {
        ...

    #ifdef CONFIG_PERF_EVENTS
        case TRACE_REG_PERF_REGISTER:
            return tracepoint_probe_register(call->tp,
                            call->class->perf_probe,
                            call);
        case TRACE_REG_PERF_UNREGISTER:
            tracepoint_probe_unregister(call->tp,
                            call->class->perf_probe,
                            call);
            return 0;
        case TRACE_REG_PERF_OPEN:
        case TRACE_REG_PERF_CLOSE:
        case TRACE_REG_PERF_ADD:
        case TRACE_REG_PERF_DEL:
            return 0;
    #endif
        }
        return 0;
    }
We can see the ‘call->class->perf_probe’ will be register to the tracepoint. From my post. We know that this ‘perf_probe’ is ‘perf_trace_##call’.
    static notrace void							\
    perf_trace_##call(void *__data, proto)					\
    {									\
        struct trace_event_call *event_call = __data;			\
        struct trace_event_data_offsets_##call __maybe_unused __data_offsets;\
        struct trace_event_raw_##call *entry;				\
        struct pt_regs *__regs;						\
        u64 __count = 1;						\
        struct task_struct *__task = NULL;				\
        struct hlist_head *head;					\
        int __entry_size;						\
        int __data_size;						\
        int rctx;							\
                                        \
        __data_size = trace_event_get_offsets_##call(&__data_offsets, args); \
                                        \
        head = this_cpu_ptr(event_call->perf_events);			\
        if (!bpf_prog_array_valid(event_call) &&			\
            __builtin_constant_p(!__task) && !__task &&			\
            hlist_empty(head))						\
            return;							\
                                        \
        __entry_size = ALIGN(__data_size + sizeof(*entry) + sizeof(u32),\
                    sizeof(u64));				\
        __entry_size -= sizeof(u32);					\
                                        \
        entry = perf_trace_buf_alloc(__entry_size, &__regs, &rctx);	\
        if (!entry)							\
            return;							\
                                        \
        perf_fetch_caller_regs(__regs);					\
                                        \
        tstruct								\
                                        \
        { assign; }							\
                                        \
        perf_trace_run_bpf_submit(entry, __entry_size, rctx,		\
                    event_call, __count, __regs,		\
                    head, __task);			\
    }
If the ‘event_call->perf_events’ is empty, it indicates there is no perf_event current added to this tracepoint. This is the default status when ‘perf_event_open’ initialize a perf_event.
perf event add
When the task is scheded in CPU, the ‘pmu->add’ will be called and it will link the ‘perf_event’ to the ‘event_call->perf_events’ linked lists.
perf event del
When the task is scheded out from CPU, the ‘pmu->del’ will be called and it will remove the ‘perf_event’ from the ‘event_call->perf_events’ linked lists.
perf event trigger
If the ‘event_call->perf_events’ is not empty, the ‘perf_trace_run_bpf_submit’ will ba called. If no eBPF program attached, the ‘perf_tp_event’ will be called.
    void perf_tp_event(u16 event_type, u64 count, void *record, int entry_size,
            struct pt_regs *regs, struct hlist_head *head, int rctx,
            struct task_struct *task)
    {
        struct perf_sample_data data;
        struct perf_event *event;

        struct perf_raw_record raw = {
            .frag = {
                .size = entry_size,
                .data = record,
            },
        };

        perf_sample_data_init(&data, 0, 0);
        data.raw = &raw;

        perf_trace_buf_update(record, event_type);

        hlist_for_each_entry_rcu(event, head, hlist_entry) {
            if (perf_tp_event_match(event, &data, regs))
                perf_swevent_event(event, count, &data, regs);
        }

        ...
        perf_swevent_put_recursion_context(rctx);
    }
For every ‘perf_event’ in ‘event_call->perf_events’ list. It call perf_swevent_event to trigger a perf event.
    static void perf_swevent_event(struct perf_event *event, u64 nr,
                    struct perf_sample_data *data,
                    struct pt_regs *regs)
    {
        struct hw_perf_event *hwc = &event->hw;

        local64_add(nr, &event->count);

        if (!regs)
            return;

        if (!is_sampling_event(event))
            return;

        if ((event->attr.sample_type & PERF_SAMPLE_PERIOD) && !event->attr.freq) {
            data->period = nr;
            return perf_swevent_overflow(event, 1, data, regs);
        } else
            data->period = event->hw.last_period;

        if (nr == 1 && hwc->sample_period == 1 && !event->attr.freq)
            return perf_swevent_overflow(event, 1, data, regs);

        if (local64_add_negative(nr, &hwc->period_left))
            return;

        perf_swevent_overflow(event, 0, data, regs);
    }
‘perf_swevent_event’ add the ‘event->count’. If the event is not sampling it just returns. Tis is the perf count mode. If the perf_event is in sample mode, it needs to copy the tracepoint data. Following is the callchain.
perf_swevent_overflow->__perf_event_overflow->event->overflow_handler(perf_event_output).
software perf event
Software PMU is defined as following:
    static struct pmu perf_swevent = {
        .task_ctx_nr	= perf_sw_context,

        .capabilities	= PERF_PMU_CAP_NO_NMI,

        .event_init	= perf_swevent_init,
        .add		= perf_swevent_add,
        .del		= perf_swevent_del,
        .start		= perf_swevent_start,
        .stop		= perf_swevent_stop,
        .read		= perf_swevent_read,
    };
perf event initialization
‘perf_swevent_init’ will be called. It call ‘swevent_hlist_get’
    static int perf_swevent_init(struct perf_event *event)
    {
        u64 event_id = event->attr.config;

        if (event->attr.type != PERF_TYPE_SOFTWARE)
            return -ENOENT;

        /*
        * no branch sampling for software events
        */
        if (has_branch_stack(event))
            return -EOPNOTSUPP;

        switch (event_id) {
        case PERF_COUNT_SW_CPU_CLOCK:
        case PERF_COUNT_SW_TASK_CLOCK:
            return -ENOENT;

        default:
            break;
        }

        if (event_id >= PERF_COUNT_SW_MAX)
            return -ENOENT;

        if (!event->parent) {
            int err;

            err = swevent_hlist_get();
            if (err)
                return err;

            static_key_slow_inc(&perf_swevent_enabled[event_id]);
            event->destroy = sw_perf_event_destroy;
        }

        return 0;
    }
This creates a percpu ‘swhash->swevent_hlist’ lists. Also set perf_swevent_enabled[event_id] to true.
perf event add
‘perf_swevent_add’ adds the perf_event to the percpu hash lists.
    static int perf_swevent_add(struct perf_event *event, int flags)
    {
        struct swevent_htable *swhash = this_cpu_ptr(&swevent_htable);
        struct hw_perf_event *hwc = &event->hw;
        struct hlist_head *head;

        if (is_sampling_event(event)) {
            hwc->last_period = hwc->sample_period;
            perf_swevent_set_period(event);
        }

        hwc->state = !(flags & PERF_EF_START);

        head = find_swevent_head(swhash, event);
        if (WARN_ON_ONCE(!head))
            return -EINVAL;

        hlist_add_head_rcu(&event->hlist_entry, head);
        perf_event_update_userpage(event);

        return 0;
    }
perf event del
‘perf_swevent_del’ remove from the hash lists.
    static void perf_swevent_del(struct perf_event *event, int flags)
    {
        hlist_del_rcu(&event->hlist_entry);
    }
perf event trigger
Take the task switch as an example.
The ‘perf_sw_event_sched’ will be called.
    static inline void perf_event_task_sched_out(struct task_struct *prev,
                            struct task_struct *next)
    {
        perf_sw_event_sched(PERF_COUNT_SW_CONTEXT_SWITCHES, 1, 0);

        if (static_branch_unlikely(&perf_sched_events))
            __perf_event_task_sched_out(prev, next);
    }
After perf_event_task_sched_out->_perf_sw_event->do_perf_sw_event callchain.
    static void do_perf_sw_event(enum perf_type_id type, u32 event_id,
                        u64 nr,
                        struct perf_sample_data *data,
                        struct pt_regs *regs)
    {
        struct swevent_htable *swhash = this_cpu_ptr(&swevent_htable);
        struct perf_event *event;
        struct hlist_head *head;

        rcu_read_lock();
        head = find_swevent_head_rcu(swhash, type, event_id);
        if (!head)
            goto end;

        hlist_for_each_entry_rcu(event, head, hlist_entry) {
            if (perf_swevent_match(event, type, event_id, data, regs))
                perf_swevent_event(event, nr, data, regs);
        }
    end:
        rcu_read_unlock();
    }
As we can see it finally calls ‘perf_swevent_event’ to trigger a event.
hardware perf event
One of the hardware PMU is defined as follows:
    static struct pmu pmu = {
        .pmu_enable		= x86_pmu_enable,
        .pmu_disable		= x86_pmu_disable,

        .attr_groups		= x86_pmu_attr_groups,

        .event_init		= x86_pmu_event_init,

        .event_mapped		= x86_pmu_event_mapped,
        .event_unmapped		= x86_pmu_event_unmapped,

        .add			= x86_pmu_add,
        .del			= x86_pmu_del,
        .start			= x86_pmu_start,
        .stop			= x86_pmu_stop,
        .read			= x86_pmu_read,

        .start_txn		= x86_pmu_start_txn,
        .cancel_txn		= x86_pmu_cancel_txn,
        .commit_txn		= x86_pmu_commit_txn,

        .event_idx		= x86_pmu_event_idx,
        .sched_task		= x86_pmu_sched_task,
        .task_ctx_size          = sizeof(struct x86_perf_task_context),
        .swap_task_ctx		= x86_pmu_swap_task_ctx,
        .check_period		= x86_pmu_check_period,

        .aux_output_match	= x86_pmu_aux_output_match,
    };
The hardware perf event is quite complicated as it will interact with the hardware. Here will not go deep in the hardware.
perf event init
    x86_pmu_event_init
        ->__x86_pmu_event_init
            ->x86_reserve_hardware
            ->x86_pmu.hw_config()
        ->validate_event
The ‘x86_pmu’ here is a arch-spec PMU structure.
perf event add
x86_pmu_add ->collect_events -> ->x86_pmu.schedule_events() ->x86_pmu.add
‘collect_events’ sets
cpuc->event_list[n] = leader;
perf event del
x86_pmu_del will delete the event in ‘cpuc->event_list’.
perf event trigger
When the hardware event triggered, it will trigger a NMI interrupt. The handler for this is ‘perf_event_nmi_handler’.
    static int
    perf_event_nmi_handler(unsigned int cmd, struct pt_regs *regs)
    {
        u64 start_clock;
        u64 finish_clock;
        int ret;

        /*
        * All PMUs/events that share this PMI handler should make sure to
        * increment active_events for their events.
        */
        if (!atomic_read(&active_events))
            return NMI_DONE;

        start_clock = sched_clock();
        ret = x86_pmu.handle_irq(regs);
        finish_clock = sched_clock();

        perf_sample_event_took(finish_clock - start_clock);

        return ret;
    }
Taks ‘x86_pmu.handle_irq’=x86_pmu_handle_irq as example.
    for (idx = 0; idx < x86_pmu.num_counters; idx++) {
        if (!test_bit(idx, cpuc->active_mask))
            continue;

        event = cpuc->events[idx];

        val = x86_perf_event_update(event);
        if (val & (1ULL << (x86_pmu.cntval_bits - 1)))
            continue;

        /*
        * event overflow
        */
        handled++;
        perf_sample_data_init(&data, 0, event->hw.last_period);

        if (!x86_perf_event_set_period(event))
            continue;

        if (perf_event_overflow(event, &data, regs))
            x86_pmu_stop(event, 0);
    }
Here we can see it iterates ‘cpuc’ to find which event trigger this interrupt.
blog comments powered by Disqus