linux-tracing-workshop-part 3
记录linux-tracing-workshop实验过程,第三部分共三篇。
- 13. Using BPF Tools: trace and argdist One-Liners
- 14. Using BPF Tools: CPU and Off-CPU Investigation
- 15. Using perf Tools: Slow File I/O
13. Using BPF Tools: trace and argdist One-Liners
使用trace显示所有登陆尝试
每当登陆系统或者使用su时,都有set*uid被调用,据此可以用trace记录所有系统的登陆和sudo操作。
    root@ubuntu1604:/usr/share/bcc/tools# ./trace '::sys_setuid "uid=%d", arg1'
    PID    TID    COMM         FUNC             -
    53999  53999  sshd         sys_setuid       uid=0
    54050  54050  su           sys_setuid       uid=1000
    54076  54076  cron         sys_setuid       uid=0
    54103  54103  cron         sys_setuid       uid=0
使用argdist指出热门文件
argdist显示函数参数的分布,可以用来trace __vfs_write 和 __vfs_read的参数用以判断出热门文件。 在一个终端启动argdist,另一个终端启动一个dd:
dd if=/dev/zero of=/dev/null bs=1K count=1M
下面是显示结果:
    root@ubuntu1604:/usr/share/bcc/tools# ./argdist -T 5 -i  2 -C 'p::__vfs_write(struct file *f):char*:f->f_path.dentry->d_name.name#writes'   -C 'p::__vfs_read(struct file  *f):char*:f->f_path.dentry->d_name.name#reads'
    [16:11:05]
    writes
            COUNT      EVENT
            1          f->f_path.dentry->d_name.name = kprobe_events
            3          f->f_path.dentry->d_name.name = [eventfd]
            3          f->f_path.dentry->d_name.name = 1
            7          f->f_path.dentry->d_name.name = TCP
    reads
            COUNT      EVENT
            1          f->f_path.dentry->d_name.name = inotify
            1          f->f_path.dentry->d_name.name = [timerfd]
            3          f->f_path.dentry->d_name.name = [eventfd]
            24         f->f_path.dentry->d_name.name = ptmx
    [16:11:07]
    writes
            COUNT      EVENT
            9          f->f_path.dentry->d_name.name = 1
            24         f->f_path.dentry->d_name.name = TCP
    reads
            COUNT      EVENT
            18         f->f_path.dentry->d_name.name = ptmx
    [16:11:09]
    writes
            COUNT      EVENT
            1          f->f_path.dentry->d_name.name = TCP
            1          f->f_path.dentry->d_name.name = 4
            6          f->f_path.dentry->d_name.name = 1
            15         f->f_path.dentry->d_name.name = TCP
            505475     f->f_path.dentry->d_name.name = null
    reads
            COUNT      EVENT
            1          f->f_path.dentry->d_name.name = TCP
            2          f->f_path.dentry->d_name.name = ld-2.23.so
            3          f->f_path.dentry->d_name.name = dd
            28         f->f_path.dentry->d_name.name = ptmx
            505475     f->f_path.dentry->d_name.name = zero
使用trace显示PostgreSQL的查询
本节直接用trace跟踪postgresql的USDT probe。
启动postgres,连到对应的数据库:
    test@ubuntu1604:/usr/local/pgsql/bin$ ./psql  -d postgres

    postgres=# \c foo
    You are now connected to database "foo" as user "test".
    foo=# select * from tbl
多次查找尝试找到对应的插入操作的进程为54397。
    ^Croot@ubuntu1604:/usr/share/bcc/tools# ps aux | grep postgres
    test     49781  0.0  0.8 172968 16660 pts/0    S    Dec06   0:00 /usr/local/pgsql/bin/postgres -D /tmp/pgdata
    test     49784  0.0  0.2 173112  4664 ?        Ss   Dec06   0:00 postgres: checkpointer
    test     49785  0.0  0.2 172968  5000 ?        Ss   Dec06   0:00 postgres: background writer
    test     49786  0.0  0.4 172968  8192 ?        Ss   Dec06   0:01 postgres: walwriter
    test     49787  0.0  0.3 173624  6440 ?        Ss   Dec06   0:00 postgres: autovacuum launcher
    test     49788  0.0  0.1  28052  2280 ?        Ss   Dec06   0:01 postgres: stats collector
    test     49789  0.0  0.1 173396  3824 ?        Ss   Dec06   0:00 postgres: logical replication launcher
    test     54372  0.0  0.2  34240  4100 pts/1    S+   16:39   0:00 ./psql -d postgres
    test     54397  0.0  0.5 173904 11152 ?        Ss   16:41   0:00 postgres: test foo [local] idle
    root     54400  0.0  0.0  15784   932 pts/4    S+   16:42   0:00 grep --color=auto postgres
    -
    ^Croot@ubuntu1604:/usr/share/bcc/tools# ./trace -p 54397 'u:/usr/local/pgsql/bin/postgres:query__start "%s", arg1'
    PID    TID    COMM         FUNC             -
    54397  54397  postgres     query__start     select * from tbl
使用argdist显示postgresql的延时分布
argdist -c -i 5 -H 'r:/usr/local/pgsql/bin/postgres:PortalRun():u64:$latency/1000000#latency (ms)'
将pg-slow.sql拷到/tmp, 然后在pgsql命令行执行
foo=# \i /tmp/pg-slow.sql
输出:
    root@ubuntu1604:/usr/share/bcc/tools# ./argdist -c -i 5 -H 'r:/usr/local/pgsql/bin/postgres:PortalRun():u64:$latency/1000000#latency (ms)'
    [17:18:00]
    latency (ms)        : count     distribution
            0 -> 1          : 1        |****************************************|
    [17:18:05]
    latency (ms)        : count     distribution
    0 -> 1          : 1        |********                                |
    2 -> 3          : 0        |                                        |
    4 -> 7          : 0        |                                        |
    8 -> 15         : 0        |                                        |
    16 -> 31         : 0        |                                        |
    32 -> 63         : 0        |                                        |
    64 -> 127        : 0        |                                        |
    128 -> 255        : 5        |****************************************|
    256 -> 511        : 0        |                                        |
    512 -> 1023       : 0        |                                        |
    1024 -> 2047       : 0        |                                        |
    2048 -> 4095       : 0        |                                        |
    4096 -> 8191       : 1        |********                                |
14. Using BPF Tools: CPU and Off-CPU Investigation
该实验调查一个表面上是CPU-bound的程序,但是实际有大部分时间没有使用CPU。
编译运行:
    root@ubuntu1604:~/linux-tracing-workshop# gcc -g -fno-omit-frame-pointer -fno-inline -pthread  blocky.c -o blocky
    root@ubuntu1604:~/linux-tracing-workshop# ./blocky
    [*] Ready to process requests.
    [*] Backend handler initialized.
    [*] Request processor initialized.
    [*] Request processor initialized.
    [-] Handled 1000 requests.
    [-] Handled 2000 requests.
看起来在以稳定的频率处理请求。
但是用top可以看到blocky的CPU利用率是很低的,说明很多时候它并没有在用CPU。
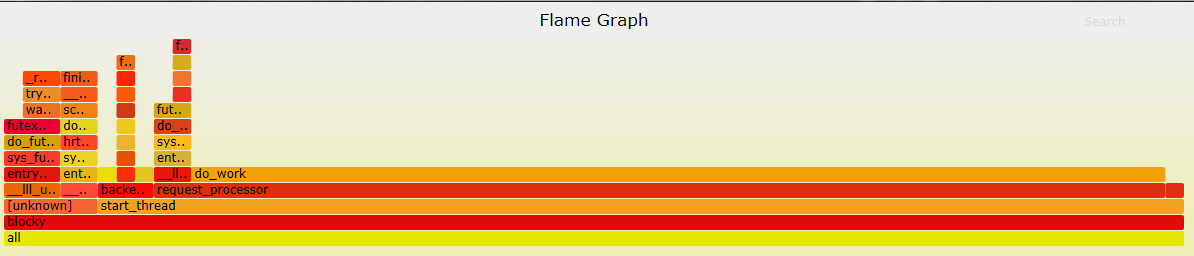
    root@ubuntu1604:/usr/share/bcc/tools# ./profile -F 997 -f -p $(pidof blocky) > folded-stacks
    root@ubuntu1604:/usr/share/bcc/tools# ~/FlameGraph/flamegraph.pl folded-stacks > profile.svg
生成火焰图,从火焰图可以看到 request_processor 和 do_work消耗了比较多的CPU, 也可以看到程序经常需要陷入对锁的等待中。
下面用cpudist查看on-cpu和off-cpu的时间各花费了多少时间:
    test@ubuntu:/usr/share/bcc/tools$ sudo ./cpudist  -p $(pidof blocky)
    [sudo] password for test:
    Tracing on-CPU time... Hit Ctrl-C to end.
    ^C
    usecs               : count     distribution
    0 -> 1          : 0        |                                        |
    2 -> 3          : 3        |***************                         |
    4 -> 7          : 3        |***************                         |
    8 -> 15         : 2        |**********                              |
    16 -> 31         : 5        |*************************               |
    32 -> 63         : 3        |***************                         |
    64 -> 127        : 5        |*************************               |
    128 -> 255        : 1        |*****                                   |
    256 -> 511        : 2        |**********                              |
    512 -> 1023       : 1        |*****                                   |
    1024 -> 2047       : 0        |                                        |
    2048 -> 4095       : 3        |***************                         |
    4096 -> 8191       : 8        |****************************************|
    8192 -> 16383      : 2        |**********                              |
从上面可以看到是双峰分布,有两个计算比较密集的点,一个比较短,一个比较长。需要关注比较短的,这说明程序在换进换出。看看off-cpu的值:
    test@ubuntu:/usr/share/bcc/tools$ sudo ./cpudist -O -p $(pidof blocky)
    Tracing off-CPU time... Hit Ctrl-C to end.
    ^C
    usecs               : count     distribution
    0 -> 1          : 2        |                                        |
    2 -> 3          : 1        |                                        |
    4 -> 7          : 4        |                                        |
    8 -> 15         : 7        |                                        |
    16 -> 31         : 7        |                                        |
    32 -> 63         : 3        |                                        |
    64 -> 127        : 48       |***                                     |
    128 -> 255        : 93       |******                                  |
    256 -> 511        : 28       |*                                       |
    512 -> 1023       : 11       |                                        |
    1024 -> 2047       : 10       |                                        |
    2048 -> 4095       : 6        |                                        |
    4096 -> 8191       : 6        |                                        |
    8192 -> 16383      : 580      |****************************************|
    16384 -> 32767      : 556      |**************************************  |
我们看到也是一个双峰分布,表示程序waiting的时间。但是这些睡眠是哪里来的,使用offcputime可以知道这个答案:
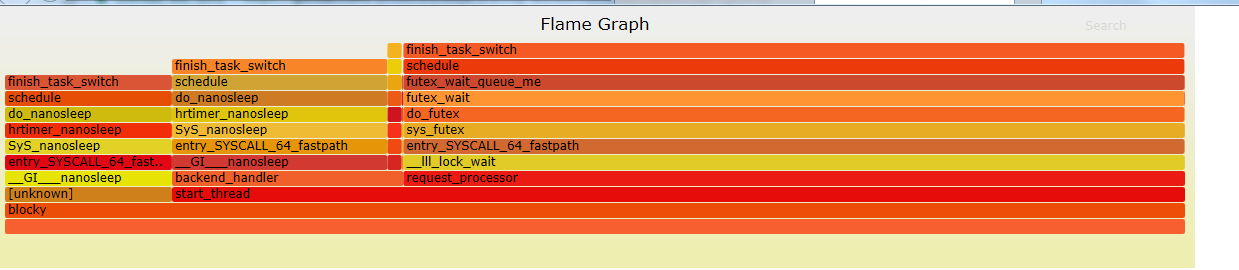
    test@ubuntu:/usr/share/bcc/tools$ sudo ./offcputime -f -p $(pidof blocky) > ~/folded-stacks
    [sudo] password for test:
    ^Ctest@ubuntu:/usr/share/bcc/tools$ ls ~
    ...
    test@ubuntu:/usr/share/bcc/tools$ ~/FlameGraph/flamegraph.pl ~/folded-stacks > offcpu.svg
    bash: offcpu.svg: Permission denied
    test@ubuntu:/usr/share/bcc/tools$ ~/FlameGraph/flamegraph.pl ~/folded-stacks > ~/offcpu.svg
    test@ubuntu:/usr/share/bcc/tools$
从火焰图可以看到确实有两条路径在等待,一个是在backend_handler调用nanosleep,一个是在request_processor调用__lll_lock_wait:
15. Using perf Tools: Slow File I/O
这个实验跟之前一样,只是这次用perf并且用火焰图显示写文件的路径。
编译运行logger:
    root@ubuntu1604:~/linux-tracing-workshop# gcc -g -fno-omit-frame-pointer -O0 -pthread logger.c -o logger
    root@ubuntu1604:~/linux-tracing-workshop# ./logger
从iolatency可以看到大部分io都能很快完成,但是也有比较慢的io:
    root@ubuntu1604:~/perf-tools# ./iolatency
    Tracing block I/O. Output every 1 seconds. Ctrl-C to end.

    >=(ms) .. <(ms)   : I/O      |Distribution                          |
    0 -> 1       : 92       |###############################       |
    1 -> 2       : 114      |######################################|
    2 -> 4       : 3        |#                                     |
    4 -> 8       : 3        |#                                     |
    8 -> 16      : 8        |###                                   |

    >=(ms) .. <(ms)   : I/O      |Distribution                          |
    0 -> 1       : 103      |##################################    |
    1 -> 2       : 117      |######################################|
    2 -> 4       : 4        |##                                    |
    4 -> 8       : 1        |#                                     |
    8 -> 16      : 4        |##                                    |

    >=(ms) .. <(ms)   : I/O      |Distribution                          |
    0 -> 1       : 96       |##################################    |
    1 -> 2       : 108      |######################################|
    2 -> 4       : 6        |###                                   |
    4 -> 8       : 1        |#                                     |
    8 -> 16      : 4        |##                                    |
    16 -> 32      : 4        |##                                    |

    >=(ms) .. <(ms)   : I/O      |Distribution                          |
    0 -> 1       : 87       |################################      |
    1 -> 2       : 106      |######################################|
    2 -> 4       : 3        |##                                    |
    4 -> 8       : 4        |##                                    |
    8 -> 16      : 6        |###                                   |
    16 -> 32      : 2        |#                                     |

    >=(ms) .. <(ms)   : I/O      |Distribution                          |
    0 -> 1       : 102      |######################################|
    1 -> 2       : 103      |######################################|
    2 -> 4       : 7        |###                                   |
    4 -> 8       : 1        |#                                     |
    8 -> 16      : 5        |##                                    |
用bitesize可以看到大部分的io都比较小,但是也有比较大的:
    root@ubuntu1604:~/perf-tools/disk# ./bitesize
    Tracing block I/O size (bytes), until Ctrl-C...
    ^C
            Kbytes         : I/O      Distribution
            -> 0.9       : 2722     |######################################|
            1.0 -> 7.9       : 2601     |##################################### |
            8.0 -> 63.9      : 1342     |###################                   |
            64.0 -> 127.9     : 0        |                                      |
            128.0 ->           : 145      |###                                   |
为了知道IO操作的来源,我们需要记录block:block_rq_insert点的栈回溯:
    root@ubuntu1604:~/perf-tools/disk# perf record -p $(pidof logger) -e block:block_rq_insert -g -- sleep 10
    [ perf record: Woken up 1 times to write data ]
    [ perf record: Captured and wrote 0.137 MB perf.data (450 samples) ]
生成火焰图:
root@ubuntu1604:~/perf-tools/disk# perf script | ~/FlameGraph/stackcollapse-perf.pl | ~/FlameGraph/flamegraph.pl > io-stacks.svg
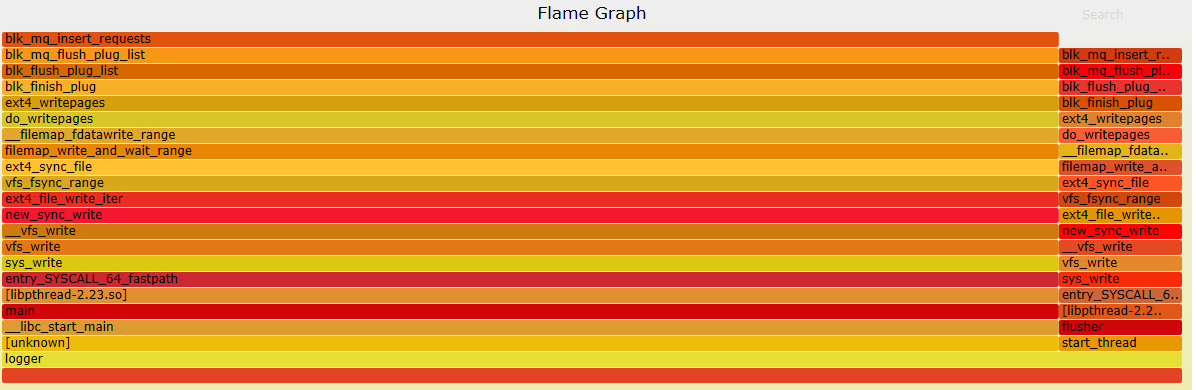
从火焰图可以看出来,IO的来源有两个线程,左边运行的时间比较多,应该就是小IO,右边运行得比较少,对应大IO。
blog comments powered by Disqus