Linux tracing - trace event framework
Sample
This post will show the trace event framework. The most important is the ‘TRACE_EVENT” expand and the connection between tracepoint with ftrace tracer. As usual we will start our discuss with an example. This example is from Using the TRACE_EVENT() macro (Part 3) . There are there files, sillymod.c,silly-trace.h,Makefile.
Then we insmod the module and see the trace print out.
            root@ubuntu:~/silly# insmod ./sillymod.ko
            root@ubuntu:~/silly# cd /sys/kernel/debug/tracing/
            root@ubuntu:/sys/kernel/debug/tracing# ls events/silly/
            enable  filter  me_silly
            root@ubuntu:/sys/kernel/debug/tracing# echo 1 > events/silly/enable
            root@ubuntu:/sys/kernel/debug/tracing# cat trace
            # tracer: nop
            #
            # entries-in-buffer/entries-written: 6/6   #P:8
            #
            #                              _-----=> irqs-off
            #                             / _----=> need-resched
            #                            | / _---=> hardirq/softirq
            #                            || / _--=> preempt-depth
            #                            ||| /     delay
            #           TASK-PID   CPU#  ||||    TIMESTAMP  FUNCTION
            #              | |       |   ||||       |         |
            silly-thread-30460 [001] .... 178964.333898: me_silly: time=4339634000 count=22
            silly-thread-30460 [001] .... 178965.358104: me_silly: time=4339634256 count=23
            silly-thread-30460 [001] .... 178966.382349: me_silly: time=4339634512 count=24
            silly-thread-30460 [001] .... 178967.405770: me_silly: time=4339634768 count=25
            silly-thread-30460 [001] .... 178968.430004: me_silly: time=4339635024 count=26
            silly-thread-30460 [001] .... 178969.453728: me_silly: time=4339635280 count=27
So the most work we do ourself is to write a MACRO ‘TRACE_EVENT’, then we got can use the ‘trace_me_silly’ function.
            TRACE_EVENT(me_silly,

                    TP_PROTO(unsigned long time, unsigned long count),

                    TP_ARGS(time, count),

                    TP_STRUCT__entry(
                            __field(	unsigned long,	time	)
                            __field(	unsigned long,	count	)
                    ),

                    TP_fast_assign(
                            __entry->time = jiffies;
                            __entry->count = count;
                    ),

                    TP_printk("time=%lu count=%lu", __entry->time, __entry->count)
            );
We will
MACRO magic
Before we go to the detail how ‘TRACE_EVENT’ work, let’s go to a small example also from the LWN posts.
            #define DOGS { C(JACK_RUSSELL), C(BULL_TERRIER), C(ITALIAN_GREYHOUND) }
            #undef C
            #define C(a) ENUM_##a
            enum dog_enums DOGS;
            #undef C
            #define C(a) #a
            char *dog_strings[] = DOGS;
            char *dog_to_string(enum dog_enums dog)
            {
                    return dog_strings[dog];
            } The magic here is the we define the 'C' MACRO two times and change the 'DOGS' MACRO behavior.
The first definition of ‘C’ will make ‘DOGS’ as an enum. So we have this:
enum dog_enums {ENUM_JACK_RUSSELL, ENUM_BULL_TERRIER, ENUM_ITALIAN_GREYHOUND};
The second definition of ‘C’ will make ‘DOGS’ as string array:
char *dog_strings = {"JACK_RUSSELL", "BULL_TERRIER", "ITALIAN_GREYHOUND"};
The ‘dog_to_string’ will return a string using the enum as index.
The key idea behind here is that we can define different code using the same information. This is why we can use the ‘trace’ by just define a ‘TRACE_EVENT’ MACRO.
TRACE_EVENT MACRO
In the final part of my last post Linux tracing - kprobe, uprobe and tracepoint. I have disscussed how ‘tracepoint’ is declared and defined. Now it’s time to see how it how it integrates with ftrace.
            #undef TRACE_SYSTEM
            #define TRACE_SYSTEM silly

            #if !defined(_SILLY_TRACE_H) || defined(TRACE_HEADER_MULTI_READ)
            #define _SILLY_TRACE_H

            #include <linux/tracepoint.h>

            TRACE_EVENT(me_silly,

                    TP_PROTO(unsigned long time, unsigned long count),

                    TP_ARGS(time, count),

                    TP_STRUCT__entry(
                            __field(	unsigned long,	time	)
                            __field(	unsigned long,	count	)
                    ),

                    TP_fast_assign(
                            __entry->time = jiffies;
                            __entry->count = count;
                    ),

                    TP_printk("time=%lu count=%lu", __entry->time, __entry->count)
            );

            #endif /* _SILLY_TRACE_H */

            /* This part must be outside protection */
            #undef TRACE_INCLUDE_PATH
            #define TRACE_INCLUDE_PATH .
            #define TRACE_INCLUDE_FILE silly-trace
            #include <trace/define_trace.h>
First using ‘defined(TRACE_HEADER_MULTI_READ)’ we can include this file several times.
First definition of 'TRACE_EVENT'
            linux/tracepoint.h
            #define TRACE_EVENT(name, proto, args, struct, assign, print)	\
                    DECLARE_TRACE(name, PARAMS(proto), PARAMS(args))
Here ‘DECLARE_TRACE’ declare a tracepoint.
Second definition of 'TRACE_EVENT'
            trace/define_trace.h
            #undef TRACE_EVENT
            #define TRACE_EVENT(name, proto, args, tstruct, assign, print)	\
                    DEFINE_TRACE(name)
Here ‘DEFINE_TRACE’ define a tracepoint.
The ‘DECLARE_TRACE’ and ‘DEFINE_TRACE’ has been disscussed in my last post. These two MACRO define a ‘struct tracepoint’ and several function, and all of the ‘tracepoint’ will be stored in the ‘__tracepoints’ section.
Third definition of 'TRACE_EVENT'
In trace/define_trace.h we will include trace/trace_events.h header file.
            trace/define_trace.h
            #include <trace/trace_events.h>
At the begining of the header file we will the ‘TRACE_EVENT’ definition as follows.
            trace/trace_events.h
            #define TRACE_EVENT(name, proto, args, tstruct, assign, print) \
                    DECLARE_EVENT_CLASS(name,			       \
                                    PARAMS(proto),		       \
                                    PARAMS(args),		       \
                                    PARAMS(tstruct),		       \
                                    PARAMS(assign),		       \
                                    PARAMS(print));		       \
                    DEFINE_EVENT(name, name, PARAMS(proto), PARAMS(args));
In this header file, the sub-MACRO ‘DECLARE_EVENT_CLASS’ and ‘DEFINE_EVENT’ will be defined five times. This means ‘TRACE_EVENT’ will be defined five times.
So see the first definition(third in total) in this file.
            #undef __field
            #define __field(type, item)		type	item;

            #undef __field_ext
            #define __field_ext(type, item, filter_type)	type	item;

            #undef __field_struct
            #define __field_struct(type, item)	type	item;

            #undef __field_struct_ext
            #define __field_struct_ext(type, item, filter_type)	type	item;

            #undef __array
            #define __array(type, item, len)	type	item[len];

            #undef __dynamic_array
            #define __dynamic_array(type, item, len) u32 __data_loc_##item;

            #undef __string
            #define __string(item, src) __dynamic_array(char, item, -1)

            #undef __bitmask
            #define __bitmask(item, nr_bits) __dynamic_array(char, item, -1)

            #undef TP_STRUCT__entry
            #define TP_STRUCT__entry(args...) args

            #undef DECLARE_EVENT_CLASS
            #define DECLARE_EVENT_CLASS(name, proto, args, tstruct, assign, print)	\
                    struct trace_event_raw_##name {					\
                            struct trace_entry	ent;				\
                            tstruct							\
                            char			__data[0];			\
                    };								\
                                                                                    \
                    static struct trace_event_class event_class_##name;

            #undef DEFINE_EVENT
            #define DEFINE_EVENT(template, name, proto, args)	\
                    static struct trace_event_call	__used		\
                    __attribute__((__aligned__(4))) event_##name
‘DECLARE_EVENT_CLASS’ defines a ‘struct trace_event_raw_##name’ and all of the data the tracer want to use is defined in this struct. The data entry can be dynamic, the information of the dynamic data is stored in ‘_data_loc##item’ and the real data is stored in ‘__data[0]’.
Fourth definition of 'TRACE_EVENT'
            #undef __field
            #define __field(type, item)

            #undef __field_ext
            #define __field_ext(type, item, filter_type)

            #undef __field_struct
            #define __field_struct(type, item)

            #undef __field_struct_ext
            #define __field_struct_ext(type, item, filter_type)

            #undef __array
            #define __array(type, item, len)

            #undef __dynamic_array
            #define __dynamic_array(type, item, len)	u32 item;

            #undef __string
            #define __string(item, src) __dynamic_array(char, item, -1)

            #undef __bitmask
            #define __bitmask(item, nr_bits) __dynamic_array(unsigned long, item, -1)

            #undef DECLARE_EVENT_CLASS
            #define DECLARE_EVENT_CLASS(call, proto, args, tstruct, assign, print)	\
                    struct trace_event_data_offsets_##call {			\
                            tstruct;						\
                    };

            #undef DEFINE_EVENT
            #define DEFINE_EVENT(template, name, proto, args)
This is quite easy as it just define a ‘struct trace_event_data_offsets_##call’, it stores the ‘dynamic data’s offset.
Fifth definition of 'TRACE_EVENT'
            #undef __entry
            #define __entry field

            #undef TP_printk
            #define TP_printk(fmt, args...) fmt "\n", args

            #undef __get_dynamic_array
            #define __get_dynamic_array(field)	\
                            ((void *)__entry + (__entry->__data_loc_##field & 0xffff))

            #undef __get_dynamic_array_len
            #define __get_dynamic_array_len(field)	\
                            ((__entry->__data_loc_##field >> 16) & 0xffff)

            #undef __get_str
            #define __get_str(field) ((char *)__get_dynamic_array(field))

            #undef __get_bitmask
            #define __get_bitmask(field)						\
                    ({								\
                            void *__bitmask = __get_dynamic_array(field);		\
                            unsigned int __bitmask_size;				\
                            __bitmask_size = __get_dynamic_array_len(field);	\
                            trace_print_bitmask_seq(p, __bitmask, __bitmask_size);	\
                    })

            #undef __print_flags
            #define __print_flags(flag, delim, flag_array...)			\
                    ({								\
                            static const struct trace_print_flags __flags[] =	\
                                    { flag_array, { -1, NULL }};			\
                            trace_print_flags_seq(p, delim, flag, __flags);	\
                    })

            #undef __print_symbolic
            #define __print_symbolic(value, symbol_array...)			\
                    ({								\
                            static const struct trace_print_flags symbols[] =	\
                                    { symbol_array, { -1, NULL }};			\
                            trace_print_symbols_seq(p, value, symbols);		\
                    })

            #undef __print_flags_u64
            #undef __print_symbolic_u64
            #if BITS_PER_LONG == 32
            #define __print_flags_u64(flag, delim, flag_array...)			\
                    ({								\
                            static const struct trace_print_flags_u64 __flags[] =	\
                                    { flag_array, { -1, NULL } };			\
                            trace_print_flags_seq_u64(p, delim, flag, __flags);	\
                    })

            #define __print_symbolic_u64(value, symbol_array...)			\
                    ({								\
                            static const struct trace_print_flags_u64 symbols[] =	\
                                    { symbol_array, { -1, NULL } };			\
                            trace_print_symbols_seq_u64(p, value, symbols);	\
                    })
            #else
            #define __print_flags_u64(flag, delim, flag_array...)			\
                                    __print_flags(flag, delim, flag_array)

            #define __print_symbolic_u64(value, symbol_array...)			\
                                    __print_symbolic(value, symbol_array)
            #endif

            #undef __print_hex
            #define __print_hex(buf, buf_len)					\
                    trace_print_hex_seq(p, buf, buf_len, false)

            #undef __print_hex_str
            #define __print_hex_str(buf, buf_len)					\
                    trace_print_hex_seq(p, buf, buf_len, true)

            #undef __print_array
            #define __print_array(array, count, el_size)				\
                    ({								\
                            BUILD_BUG_ON(el_size != 1 && el_size != 2 &&		\
                                    el_size != 4 && el_size != 8);		\
                            trace_print_array_seq(p, array, count, el_size);	\
                    })

            #undef DECLARE_EVENT_CLASS
            #define DECLARE_EVENT_CLASS(call, proto, args, tstruct, assign, print)	\
            static notrace enum print_line_t					\
            trace_raw_output_##call(struct trace_iterator *iter, int flags,		\
                                    struct trace_event *trace_event)		\
            {									\
                    struct trace_seq *s = &iter->seq;				\
                    struct trace_seq __maybe_unused *p = &iter->tmp_seq;		\
                    struct trace_event_raw_##call *field;				\
                    int ret;							\
                                                                                    \
                    field = (typeof(field))iter->ent;				\
                                                                                    \
                    ret = trace_raw_output_prep(iter, trace_event);			\
                    if (ret != TRACE_TYPE_HANDLED)					\
                            return ret;						\
                                                                                    \
                    trace_seq_printf(s, print);					\
                                                                                    \
                    return trace_handle_return(s);					\
            }									\
            static struct trace_event_functions trace_event_type_funcs_##call = {	\
                    .trace			= trace_raw_output_##call,		\
            };
Here define a ‘trace_raw_output_##call’ function this is used to print the raw event data(in ringbuffer) to tracer’s buffer(output buffer). The raw data is stored in ‘iter->ent’. Also there is a ‘struct trace_event_type_funcs_##call’ has been defined. Also here will process the special ‘print’.
Sixth definition of 'TRACE_EVENT'
            #undef __field_ext
            #define __field_ext(type, item, filter_type)				\
                    ret = trace_define_field(event_call, #type, #item,		\
                                            offsetof(typeof(field), item),		\
                                            sizeof(field.item),			\
                                            is_signed_type(type), filter_type);	\
                    if (ret)							\
                            return ret;

            #undef __field_struct_ext
            #define __field_struct_ext(type, item, filter_type)			\
                    ret = trace_define_field(event_call, #type, #item,		\
                                            offsetof(typeof(field), item),		\
                                            sizeof(field.item),			\
                                            0, filter_type);			\
                    if (ret)							\
                            return ret;

            #undef __field
            #define __field(type, item)	__field_ext(type, item, FILTER_OTHER)

            #undef __field_struct
            #define __field_struct(type, item) __field_struct_ext(type, item, FILTER_OTHER)

            #undef __array
            #define __array(type, item, len)					\
                    do {								\
                            char *type_str = #type"["__stringify(len)"]";		\
                            BUILD_BUG_ON(len > MAX_FILTER_STR_VAL);			\
                            ret = trace_define_field(event_call, type_str, #item,	\
                                            offsetof(typeof(field), item),		\
                                            sizeof(field.item),			\
                                            is_signed_type(type), FILTER_OTHER);	\
                            if (ret)						\
                                    return ret;					\
                    } while (0);

            #undef __dynamic_array
            #define __dynamic_array(type, item, len)				       \
                    ret = trace_define_field(event_call, "__data_loc " #type "[]", #item,  \
                                            offsetof(typeof(field), __data_loc_##item),   \
                                            sizeof(field.__data_loc_##item),	       \
                                            is_signed_type(type), FILTER_OTHER);

            #undef __string
            #define __string(item, src) __dynamic_array(char, item, -1)

            #undef __bitmask
            #define __bitmask(item, nr_bits) __dynamic_array(unsigned long, item, -1)

            #undef DECLARE_EVENT_CLASS
            #define DECLARE_EVENT_CLASS(call, proto, args, tstruct, func, print)	\
            static int notrace __init						\
            trace_event_define_fields_##call(struct trace_event_call *event_call)	\
            {									\
                    struct trace_event_raw_##call field;				\
                    int ret;							\
                                                                                    \
                    tstruct;							\
                                                                                    \
                    return ret;							\
            }
Here we define function ‘trace_event_define_fields_##call’. In this function, it calls ‘trace_define_field’ for every member in ‘TP_STRUCT__entry’. The ‘trace_define_field’ will insert the field infomation to the linked list ‘event_call->class->fields’ lists. It will be used in the ftrace framework.
Seventh definition of 'TRACE_EVENT'
            #undef __entry
            #define __entry entry

            #undef __field
            #define __field(type, item)

            #undef __field_ext
            #define __field_ext(type, item, filter_type)

            #undef __field_struct
            #define __field_struct(type, item)

            #undef __field_struct_ext
            #define __field_struct_ext(type, item, filter_type)

            #undef __array
            #define __array(type, item, len)

            #undef __dynamic_array
            #define __dynamic_array(type, item, len)				\
                    __item_length = (len) * sizeof(type);				\
                    __data_offsets->item = __data_size +				\
                                    offsetof(typeof(*entry), __data);	\
                    __data_offsets->item |= __item_length << 16;			\
                    __data_size += __item_length;

            #undef __string
            #define __string(item, src) __dynamic_array(char, item,			\
                            strlen((src) ? (const char *)(src) : "(null)") + 1)

            /*
            * __bitmask_size_in_bytes_raw is the number of bytes needed to hold
            * num_possible_cpus().
            */
            #define __bitmask_size_in_bytes_raw(nr_bits)	\
                    (((nr_bits) + 7) / 8)

            #define __bitmask_size_in_longs(nr_bits)			\
                    ((__bitmask_size_in_bytes_raw(nr_bits) +		\
                    ((BITS_PER_LONG / 8) - 1)) / (BITS_PER_LONG / 8))

            /*
            * __bitmask_size_in_bytes is the number of bytes needed to hold
            * num_possible_cpus() padded out to the nearest long. This is what
            * is saved in the buffer, just to be consistent.
            */
            #define __bitmask_size_in_bytes(nr_bits)				\
                    (__bitmask_size_in_longs(nr_bits) * (BITS_PER_LONG / 8))

            #undef __bitmask
            #define __bitmask(item, nr_bits) __dynamic_array(unsigned long, item,	\
                                                    __bitmask_size_in_longs(nr_bits))

            #undef DECLARE_EVENT_CLASS
            #define DECLARE_EVENT_CLASS(call, proto, args, tstruct, assign, print)	\
            static inline notrace int trace_event_get_offsets_##call(		\
                    struct trace_event_data_offsets_##call *__data_offsets, proto)	\
            {									\
                    int __data_size = 0;						\
                    int __maybe_unused __item_length;				\
                    struct trace_event_raw_##call __maybe_unused *entry;		\
                                                                                    \
                    tstruct;							\
                                                                                    \
                    return __data_size;						\
            }
This time define a function ‘trace_event_get_offsets_##call’ this is used to calcute the length and offset in every dynmaic member in ‘TP_STRUCT__entry’. It is stored in ‘struct trace_event_data_offsets_##call’ which is defined in the fourth round expand.
Eighth definition of 'TRACE_EVENT'
            #undef __entry
            #define __entry entry

            #undef __field
            #define __field(type, item)

            #undef __field_struct
            #define __field_struct(type, item)

            #undef __array
            #define __array(type, item, len)

            #undef __dynamic_array
            #define __dynamic_array(type, item, len)				\
                    __entry->__data_loc_##item = __data_offsets.item;

            #undef __string
            #define __string(item, src) __dynamic_array(char, item, -1)

            #undef __assign_str
            #define __assign_str(dst, src)						\
                    strcpy(__get_str(dst), (src) ? (const char *)(src) : "(null)");

            #undef __bitmask
            #define __bitmask(item, nr_bits) __dynamic_array(unsigned long, item, -1)

            #undef __get_bitmask
            #define __get_bitmask(field) (char *)__get_dynamic_array(field)

            #undef __assign_bitmask
            #define __assign_bitmask(dst, src, nr_bits)					\
                    memcpy(__get_bitmask(dst), (src), __bitmask_size_in_bytes(nr_bits))

            #undef TP_fast_assign
            #define TP_fast_assign(args...) args

            #undef __perf_count
            #define __perf_count(c)	(c)

            #undef __perf_task
            #define __perf_task(t)	(t)

            #undef DECLARE_EVENT_CLASS
            #define DECLARE_EVENT_CLASS(call, proto, args, tstruct, assign, print)	\
                                                                                    \
            static notrace void							\
            trace_event_raw_event_##call(void *__data, proto)			\
            {									\
                    struct trace_event_file *trace_file = __data;			\
                    struct trace_event_data_offsets_##call __maybe_unused __data_offsets;\
                    struct trace_event_buffer fbuffer;				\
                    struct trace_event_raw_##call *entry;				\
                    int __data_size;						\
                                                                                    \
                    if (trace_trigger_soft_disabled(trace_file))			\
                            return;							\
                                                                                    \
                    __data_size = trace_event_get_offsets_##call(&__data_offsets, args); \
                                                                                    \
                    entry = trace_event_buffer_reserve(&fbuffer, trace_file,	\
                                            sizeof(*entry) + __data_size);		\
                                                                                    \
                    if (!entry)							\
                            return;							\
                                                                                    \
                    tstruct								\
                                                                                    \
                    { assign; }							\
                                                                                    \
                    trace_event_buffer_commit(&fbuffer);				\
            }
Here define function ‘trace_event_raw_event_##call’. This function call ‘trace_trigger_soft_disabled’ to determine whether it will record data. Then ‘trace_event_get_offsets_##call’ to calculate the dynmaic data’s offset and size. Call ‘trace_event_buffer_reserve’ to reverse the space in ringbuffer. The ‘tstruct’ will assign ‘_entry->__data_loc##item’. Commit the ringbuffer by calling ‘trace_event_buffer_commit’.
Nineth definition of 'TRACE_EVENT'
            #undef __entry
            #define __entry REC

            #undef __print_flags
            #undef __print_symbolic
            #undef __print_hex
            #undef __print_hex_str
            #undef __get_dynamic_array
            #undef __get_dynamic_array_len
            #undef __get_str
            #undef __get_bitmask
            #undef __print_array

            #undef TP_printk
            #define TP_printk(fmt, args...) "\"" fmt "\", "  __stringify(args)

            #undef DECLARE_EVENT_CLASS
            #define DECLARE_EVENT_CLASS(call, proto, args, tstruct, assign, print)	\
            _TRACE_PERF_PROTO(call, PARAMS(proto));					\
            static char print_fmt_##call[] = print;					\
            static struct trace_event_class __used __refdata event_class_##call = { \
                    .system			= TRACE_SYSTEM_STRING,			\
                    .define_fields		= trace_event_define_fields_##call,	\
                    .fields			= LIST_HEAD_INIT(event_class_##call.fields),\
                    .raw_init		= trace_event_raw_init,			\
                    .probe			= trace_event_raw_event_##call,		\
                    .reg			= trace_event_reg,			\
                    _TRACE_PERF_INIT(call)						\
            };

            #undef DEFINE_EVENT
            #define DEFINE_EVENT(template, call, proto, args)			\
                                                                                    \
            static struct trace_event_call __used event_##call = {			\
                    .class			= &event_class_##template,		\
                    {								\
                            .tp			= &__tracepoint_##call,		\
                    },								\
                    .event.funcs		= &trace_event_type_funcs_##template,	\
                    .print_fmt		= print_fmt_##template,			\
                    .flags			= TRACE_EVENT_FL_TRACEPOINT,		\
            };									\
            static struct trace_event_call __used					\
            __attribute__((section("_ftrace_events"))) *__event_##call = &event_##call
Here define ‘struct trace_event_class’ named ‘event_class_##call’. and ‘struct trace_event_call’ named ‘event_#call’. The call of the class is ‘trace_event_raw_event_##call’ which is defined in the Eighth round expand. All of the ‘event_##call’ will be stored in the ‘_ftrace_events’ section.
This is story of ‘TRACE_EVNT’, a lot of operation just like a fierce tiger(一顿操作猛如虎). Let’s summary what we have does now.
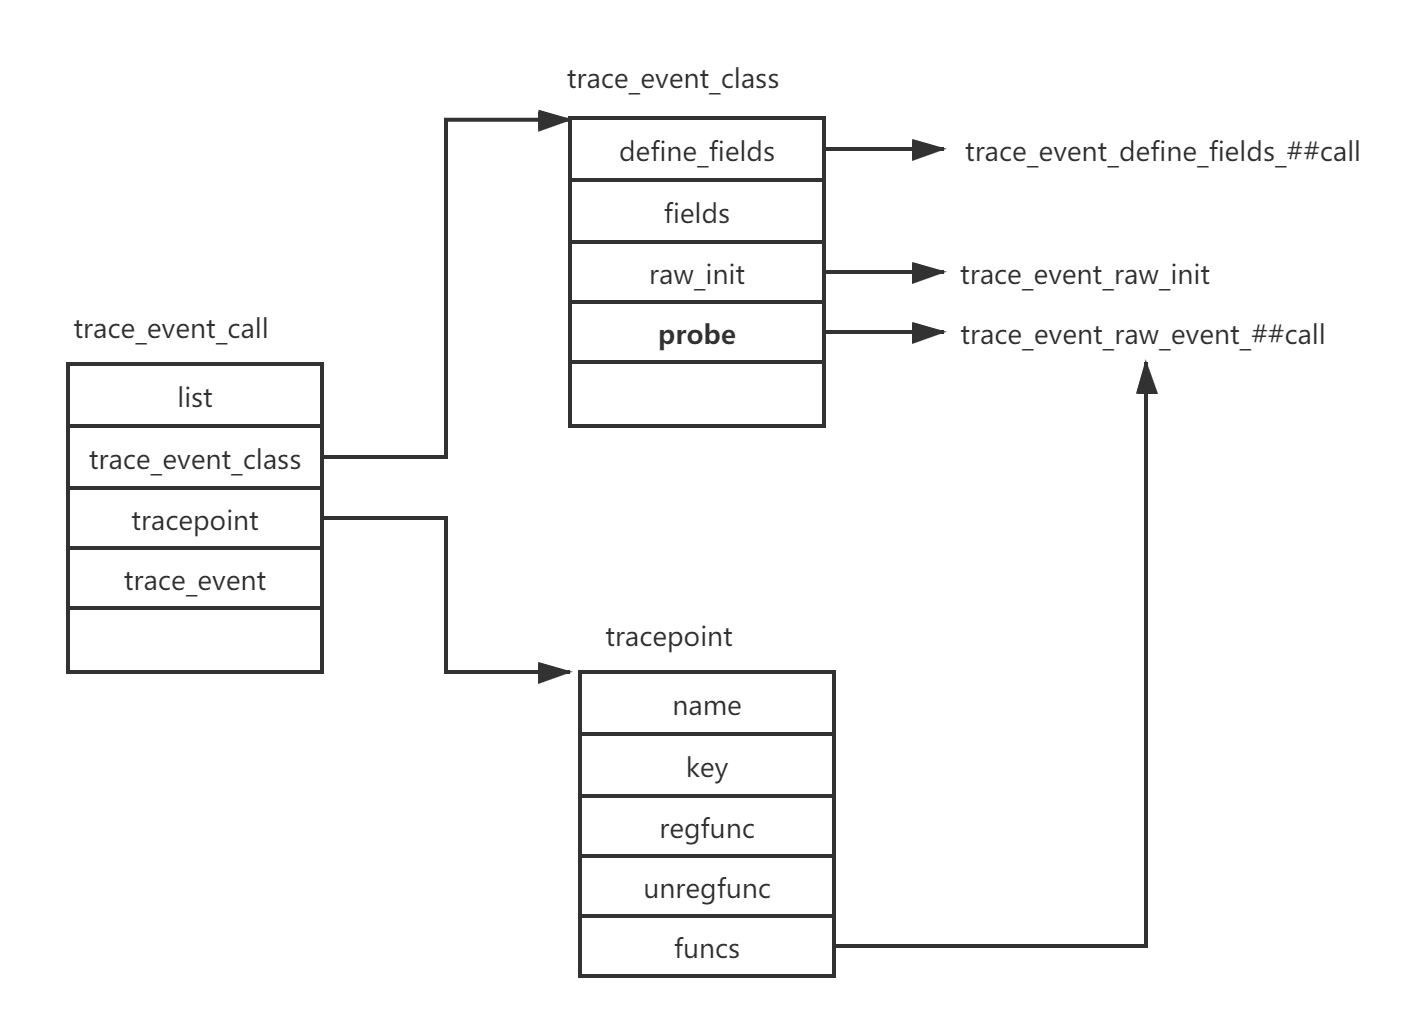
In the ‘TRACE_EVENT’ we have defined a ‘trace_event_call’ and some related function and structures. The most important is ‘trace_event_class’s probe function ‘trace_event_raw_event_##call’. When the function call trace function(trace_me_silly for example), it will call the ‘tracepoint’s funcs function, this is the ‘probe’ function. In the probe function ‘trace_event_raw_event_##call’, it will construct a ringbuffer and fill the data and commit the buffer, then it will call ‘trace_raw_output_##call’ to copy the ringbuffer data to output buffer. Next let’s see how this happen.
trace event init
The ftrace framework is another complicated things. So here let’s just focus the trace event part.
Some of the important function in the trace event init process is following:
start_kernel() ->early_trace_init() ->trace_init() ->event_trace_enable() ->event_init() ->__trace_early_add_events() ->__trace_early_add_new_event() ->trace_create_new_event()
In event_trace_enable(), it iterates the ‘__ftrace_events’ section. For every ‘trace_event_call’, it will call ‘event_init’. Here we will call ‘call->call->raw_init()’. It’s trace_event_raw_init.
            static int event_init(struct trace_event_call *call)
            {
                    int ret = 0;
                    const char *name;

                    name = trace_event_name(call);
                    if (WARN_ON(!name))
                            return -EINVAL;

                    if (call->class->raw_init) {
                            ret = call->class->raw_init(call);
                            if (ret < 0 && ret != -ENOSYS)
                                    pr_warn("Could not initialize trace events/%s\n", name);
                    }

                    return ret;
            }
trace_event_raw_init calls register_trace_event which will initialize the ‘trace_event’ member named ‘event’ in ‘trace_event_call’. This will insert the ‘trace_event’ in a global ‘event_hash’ hashmap.
event_trace_enable will also insert the ‘trace_event_call’ in the global ‘ftrace_events’ linked lists.
In ‘__trace_early_add_events’s call chain, there will be a ‘trace_event_file’ be created for every ‘trace_event_call’(by ‘trace_create_new_event’).
            static struct trace_event_file *
            trace_create_new_event(struct trace_event_call *call,
                            struct trace_array *tr)
            {
                    struct trace_event_file *file;

                    file = kmem_cache_alloc(file_cachep, GFP_TRACE);
                    if (!file)
                            return NULL;

                    file->event_call = call;
                    file->tr = tr;
                    atomic_set(&file->sm_ref, 0);
                    atomic_set(&file->tm_ref, 0);
                    INIT_LIST_HEAD(&file->triggers);
                    list_add(&file->list, &tr->events);

                    return file;
            }
Later in the fs_initcall(event_trace_init). It will create the directory and file about the event. event_trace_init() ->early_event_add_tracer() ->__trace_early_add_event_dirs() ->event_create_dir()
In the final ‘event_create_dir’ function, we create the direcotry and file. It may create a subsystem directory.
enable trace event
When we write the ‘enable’ file, the ‘event_enable_write’ will handle this.
            if (call->class->reg && !(call->flags & TRACE_EVENT_FL_IGNORE_ENABLE))
                    trace_create_file("enable", 0644, file->dir, file,
                                    &ftrace_enable_fops);

            static const struct file_operations ftrace_enable_fops = {
                    .open = tracing_open_generic,
                    .read = event_enable_read,
                    .write = event_enable_write,
                    .llseek = default_llseek,
            };

            static ssize_t
            event_enable_write(struct file *filp, const char __user *ubuf, size_t cnt,
                            loff_t *ppos)
            {
                    struct trace_event_file *file;
                    unsigned long val;
                    int ret;

                    ret = kstrtoul_from_user(ubuf, cnt, 10, &val);
                    if (ret)
                            return ret;

                    ret = tracing_update_buffers();
                    if (ret < 0)
                            return ret;

                    switch (val) {
                    case 0:
                    case 1:
                            ret = -ENODEV;
                            mutex_lock(&event_mutex);
                            file = event_file_data(filp);
                            if (likely(file))
                                    ret = ftrace_event_enable_disable(file, val);
                            mutex_unlock(&event_mutex);
                            break;

                    default:
                            return -EINVAL;
                    }

                    *ppos += cnt;

                    return ret ? ret : cnt;
            }
After the callchain ftrace_event_enable_disable->_ftrace_event_enable_disable->call->class->reg, the ‘trace_event_class’s reg callback will be called. This is ‘trace_event_reg’. ‘class->class-probe’ is ‘trace_event_raw_event##call’. After a long callchain, ‘trace_event_raw_event_##call’ is added to the ‘tracepoint’s funcs member.
            int trace_event_reg(struct trace_event_call *call,
                            enum trace_reg type, void *data)
            {
                    struct trace_event_file *file = data;

                    WARN_ON(!(call->flags & TRACE_EVENT_FL_TRACEPOINT));
                    switch (type) {
                    case TRACE_REG_REGISTER:
                            return tracepoint_probe_register(call->tp,
                                                            call->class->probe,
                                                            file);
                    case TRACE_REG_UNREGISTER:
                            tracepoint_probe_unregister(call->tp,
                                                    call->class->probe,
                                                    file);
                            return 0;

           ...
                    return 0;
            }
‘tracepoint_probe_register’ will be called.
            int tracepoint_probe_register(struct tracepoint *tp, void *probe, void *data)
            {
                    return tracepoint_probe_register_prio(tp, probe, data, TRACEPOINT_DEFAULT_PRIO);
            }

            int tracepoint_probe_register_prio(struct tracepoint *tp, void *probe,
                                            void *data, int prio)
            {
                    struct tracepoint_func tp_func;
                    int ret;

                    mutex_lock(&tracepoints_mutex);
                    tp_func.func = probe;
                    tp_func.data = data;
                    tp_func.prio = prio;
                    ret = tracepoint_add_func(tp, &tp_func, prio);
                    mutex_unlock(&tracepoints_mutex);
                    return ret;
            }

            static int tracepoint_add_func(struct tracepoint *tp,
                                    struct tracepoint_func *func, int prio)
            {
                    struct tracepoint_func *old, *tp_funcs;
                    int ret;

                    if (tp->regfunc && !static_key_enabled(&tp->key)) {
                            ret = tp->regfunc();
                            if (ret < 0)
                                    return ret;
                    }

                    tp_funcs = rcu_dereference_protected(tp->funcs,
                                    lockdep_is_held(&tracepoints_mutex));
                    old = func_add(&tp_funcs, func, prio);
                    if (IS_ERR(old)) {
                            WARN_ON_ONCE(1);
                            return PTR_ERR(old);
                    }

                    /*
                    * rcu_assign_pointer has a smp_wmb() which makes sure that the new
                    * probe callbacks array is consistent before setting a pointer to it.
                    * This array is referenced by __DO_TRACE from
                    * include/linux/tracepoints.h. A matching smp_read_barrier_depends()
                    * is used.
                    */
                    rcu_assign_pointer(tp->funcs, tp_funcs);
                    if (!static_key_enabled(&tp->key))
                            static_key_slow_inc(&tp->key);
                    release_probes(old);
                    return 0;
            }
blog comments powered by Disqus